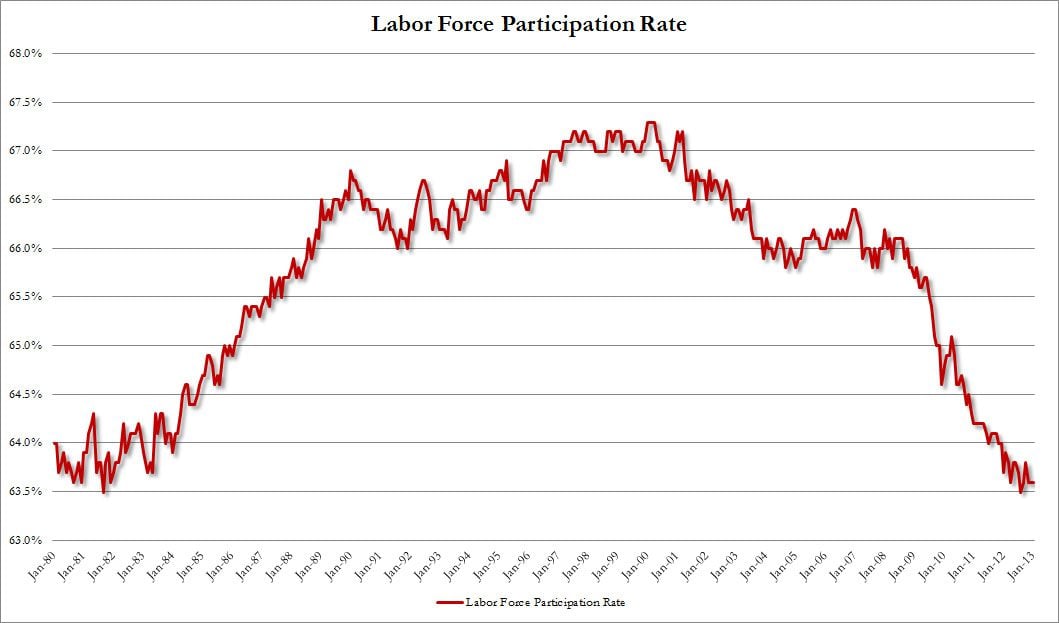
8.5 Million Fewer Americans Are In The Labour Force Than When Obama Took Office
(h/t Jim Hoft)
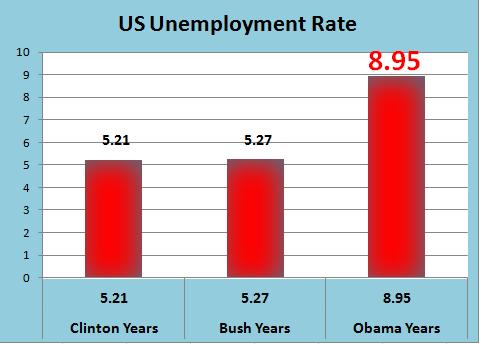
Average Unemployment Rate For Clinton, Bush And Obama
Austerity, My Ass! Federal Spending Set To Climb 2% This Year
ESAD, NYT, Krugman, Klein, and the rest of you Neo-Keynesians, who even Maynard would say are nothing but batshit crazy loons, barking at the moon. From John Merline of Investors' Business Daily:

How To Spend $7.66 Trillion In Stimulus Spending In 6 Years
Throwing it to Geri Willis of Fox Business:
Sometimes numbers tell the story and tonight there is one number that
tells you everything you need to know about what's wrong with
Washington's playbook.
That number is $7.66 trillion in taxpayer dollars. That's the total
of all the stimulus dollars the Federal Government has used to set this
nation's economy back on the right path. It’s 49 percent of our nation's
GDP.
In other words, we spent half of what the world's largest economy can
produce in a single year to bail out. The list is long. Take a
look....
Bear Stearns: $29B
Economic stimulus checks: $178B
Bush Home Owners bailout: $300B
Fannie Mae and Freddie Mac bailout: $400B
AIG bailout: $42B
Emergency Economic Stabilization Act of 2008 (TARP): $700B
Automakers bailout: $25B
American Recovery and Reinvestment Act of 2009: $787B
Obama Home Owners bailout: $275B
Small business loans: $15B
Automakers bailout: $22B
Quantitative Easing I: $1.75T
Quantitative Easing II: $600B
Quantitative Easing III: $960B
Quantitative Easing IV: $1.08T
Operation Twist: $400B
Extending Payroll Tax Cut: $100B
Whew! That's a lot of money and where are we? Nowhere, as far as I
can tell. Unemployment is at 7.8%, exactly where it was when President
Obama came into office.
The economy is contracting, shrinking, and consumers and taxpayers
say they aren't too happy. It's no wonder. All of this money out the
door and much of it will have to be paid back. Our economy hasn't
recovered. The stimulus spending was a bust!
Next time you hear Paul Krugman say we need more stimulus spending, ask him:
Where's my $7.66 trillion, mister?
And, what did we get for all of this?
Misery Index
| Year | UR | Bar Graph | President |
| 1948-01 | 3.40 | Truman | |
| 1948-02 | 3.80 | ||
| 1948-03 | 4.00 | ||
| 1948-04 | 3.90 | ||
| 1948-05 | 3.50 | ||
| 1948-06 | 3.60 | Berlin airlift | |
| 1948-07 | 3.60 | ||
| 1948-08 | 3.90 | ||
| 1948-09 | 3.80 | ||
| 1948-10 | 3.70 | ||
| 1948-11 | 3.80 | ||
| 1948-12 | 4.00 | ||
| 1949-01 | 4.30 | ||
| 1949-02 | 4.70 | ||
| 1949-03 | 5.00 | ||
| 1949-04 | 5.30 | ||
| 1949-05 | 6.10 | ||
| 1949-06 | 6.20 | ||
| 1949-07 | 6.70 | ||
| 1949-08 | 6.80 | ||
| 1949-09 | 6.60 | ||
| 1949-10 | 7.90 | ||
| 1949-11 | 6.40 | ||
| 1949-12 | 6.60 | ||
| 1950-01 | 6.50 | Min. Wage = $0.75 | |
| 1950-02 | 6.40 | ||
| 1950-03 | 6.30 | ||
| 1950-04 | 5.80 | ||
| 1950-05 | 5.50 | ||
| 1950-06 | 5.40 | US Enters Korean War | |
| 1950-07 | 5.00 | ||
| 1950-08 | 4.50 | ||
| 1950-09 | 4.40 | ||
| 1950-10 | 4.20 | ||
| 1950-11 | 4.20 | ||
| 1950-12 | 4.30 | ||
| 1951-01 | 3.70 | ||
| 1951-02 | 3.40 | ||
| 1951-03 | 3.40 | ||
| 1951-04 | 3.10 | ||
| 1951-05 | 3.00 | ||
| 1951-06 | 3.20 | ||
| 1951-07 | 3.10 | ||
| 1951-08 | 3.10 | ||
| 1951-09 | 3.30 | ||
| 1951-10 | 3.50 | ||
| 1951-11 | 3.50 | ||
| 1951-12 | 3.10 | ||
| 1952-01 | 3.20 | ||
| 1952-02 | 3.10 | ||
| 1952-03 | 2.90 | ||
| 1952-04 | 2.90 | ||
| 1952-05 | 3.00 | ||
| 1952-06 | 3.00 | ||
| 1952-07 | 3.20 | ||
| 1952-08 | 3.40 | ||
| 1952-09 | 3.10 | ||
| 1952-10 | 3.00 | ||
| 1952-11 | 2.80 | ||
| 1952-12 | 2.70 | ||
| 1953-01 | 2.90 | Eisenhower | |
| 1953-02 | 2.60 | ||
| 1953-03 | 2.60 | ||
| 1953-04 | 2.70 | ||
| 1953-05 | 2.50 | ||
| 1953-06 | 2.50 | ||
| 1953-07 | 2.60 | Korean War Armistice | |
| 1953-08 | 2.70 | ||
| 1953-09 | 2.90 | ||
| 1953-10 | 3.10 | ||
| 1953-11 | 3.50 | ||
| 1953-12 | 4.50 | ||
| 1954-01 | 4.90 | ||
| 1954-02 | 5.20 | ||
| 1954-03 | 5.70 | ||
| 1954-04 | 5.90 | ||
| 1954-05 | 5.90 | ||
| 1954-06 | 5.60 | ||
| 1954-07 | 5.80 | ||
| 1954-08 | 6.00 | ||
| 1954-09 | 6.10 | ||
| 1954-10 | 5.70 | ||
| 1954-11 | 5.30 | ||
| 1954-12 | 5.00 | ||
| 1955-01 | 4.90 | ||
| 1955-02 | 4.70 | ||
| 1955-03 | 4.60 | ||
| 1955-04 | 4.70 | ||
| 1955-05 | 4.30 | ||
| 1955-06 | 4.20 | ||
| 1955-07 | 4.00 | ||
| 1955-08 | 4.20 | ||
| 1955-09 | 4.10 | ||
| 1955-10 | 4.30 | ||
| 1955-11 | 4.20 | ||
| 1955-12 | 4.20 | ||
| 1956-01 | 4.00 | ||
| 1956-02 | 3.90 | ||
| 1956-03 | 4.20 | Min. Wage = $1 | |
| 1956-04 | 4.00 | ||
| 1956-05 | 4.30 | ||
| 1956-06 | 4.30 | ||
| 1956-07 | 4.40 | ||
| 1956-08 | 4.10 | ||
| 1956-09 | 3.90 | ||
| 1956-10 | 3.90 | ||
| 1956-11 | 4.30 | ||
| 1956-12 | 4.20 | ||
| 1957-01 | 4.20 | ||
| 1957-02 | 3.90 | ||
| 1957-03 | 3.70 | ||
| 1957-04 | 3.90 | ||
| 1957-05 | 4.10 | ||
| 1957-06 | 4.30 | ||
| 1957-07 | 4.20 | ||
| 1957-08 | 4.10 | ||
| 1957-09 | 4.40 | ||
| 1957-10 | 4.50 | ||
| 1957-11 | 5.10 | ||
| 1957-12 | 5.20 | ||
| 1958-01 | 5.80 | ||
| 1958-02 | 6.40 | ||
| 1958-03 | 6.70 | ||
| 1958-04 | 7.40 | ||
| 1958-05 | 7.40 | ||
| 1958-06 | 7.30 | ||
| 1958-07 | 7.50 | ||
| 1958-08 | 7.40 | ||
| 1958-09 | 7.10 | ||
| 1958-10 | 6.70 | ||
| 1958-11 | 6.20 | ||
| 1958-12 | 6.20 | ||
| 1959-01 | 6.00 | Alaska becomes 49th State | |
| 1959-02 | 5.90 | ||
| 1959-03 | 5.60 | ||
| 1959-04 | 5.20 | ||
| 1959-05 | 5.10 | ||
| 1959-06 | 5.00 | ||
| 1959-07 | 5.10 | ||
| 1959-08 | 5.20 | Hawaii becomes 50th State | |
| 1959-09 | 5.50 | ||
| 1959-10 | 5.70 | ||
| 1959-11 | 5.80 | ||
| 1959-12 | 5.30 | ||
| 1960-01 | 5.20 | ||
| 1960-02 | 4.80 | ||
| 1960-03 | 5.40 | ||
| 1960-04 | 5.20 | ||
| 1960-05 | 5.10 | ||
| 1960-06 | 5.40 | ||
| 1960-07 | 5.50 | ||
| 1960-08 | 5.60 | ||
| 1960-09 | 5.50 | ||
| 1960-10 | 6.10 | ||
| 1960-11 | 6.10 | ||
| 1960-12 | 6.60 | ||
| 1961-01 | 6.60 | Kennedy Bay of Pigs invasion of Cuba |
|
| 1961-02 | 6.90 | ||
| 1961-03 | 6.90 | ||
| 1961-04 | 7.00 | ||
| 1961-05 | 7.10 | ||
| 1961-06 | 6.90 | ||
| 1961-07 | 7.00 | ||
| 1961-08 | 6.60 | ||
| 1961-09 | 6.70 | Min. Wage = $1.15 | |
| 1961-10 | 6.50 | ||
| 1961-11 | 6.10 | ||
| 1961-12 | 6.00 | ||
| 1962-01 | 5.80 | ||
| 1962-02 | 5.50 | Cuban Missile Crisis | |
| 1962-03 | 5.60 | ||
| 1962-04 | 5.60 | ||
| 1962-05 | 5.50 | ||
| 1962-06 | 5.50 | ||
| 1962-07 | 5.40 | ||
| 1962-08 | 5.70 | ||
| 1962-09 | 5.60 | ||
| 1962-10 | 5.40 | ||
| 1962-11 | 5.70 | ||
| 1962-12 | 5.50 | ||
| 1963-01 | 5.70 | ||
| 1963-02 | 5.90 | ||
| 1963-03 | 5.70 | ||
| 1963-04 | 5.70 | ||
| 1963-05 | 5.90 | ||
| 1963-06 | 5.60 | ||
| 1963-07 | 5.60 | ||
| 1963-08 | 5.40 | ||
| 1963-09 | 5.50 | Min. Wage = $1.25 | |
| 1963-10 | 5.50 | ||
| 1963-11 | 5.70 | Johnson | |
| 1963-12 | 5.50 | ||
| 1964-01 | 5.60 | ||
| 1964-02 | 5.40 | ||
| 1964-03 | 5.40 | ||
| 1964-04 | 5.30 | ||
| 1964-05 | 5.10 | ||
| 1964-06 | 5.20 | ||
| 1964-07 | 4.90 | ||
| 1964-08 | 5.00 | US Enters Vietnam War | |
| 1964-09 | 5.10 | ||
| 1964-10 | 5.10 | ||
| 1964-11 | 4.80 | ||
| 1964-12 | 5.00 | ||
| 1965-01 | 4.90 | ||
| 1965-02 | 5.10 | ||
| 1965-03 | 4.70 | ||
| 1965-04 | 4.80 | ||
| 1965-05 | 4.60 | ||
| 1965-06 | 4.60 | ||
| 1965-07 | 4.40 | ||
| 1965-08 | 4.40 | ||
| 1965-09 | 4.30 | ||
| 1965-10 | 4.20 | ||
| 1965-11 | 4.10 | ||
| 1965-12 | 4.00 | ||
| 1966-01 | 4.00 | ||
| 1966-02 | 3.80 | ||
| 1966-03 | 3.80 | ||
| 1966-04 | 3.80 | ||
| 1966-05 | 3.90 | ||
| 1966-06 | 3.80 | ||
| 1966-07 | 3.80 | ||
| 1966-08 | 3.80 | ||
| 1966-09 | 3.70 | ||
| 1966-10 | 3.70 | ||
| 1966-11 | 3.60 | ||
| 1966-12 | 3.80 | ||
| 1967-01 | 3.90 | ||
| 1967-02 | 3.80 | Min. Wage = $1.4 | |
| 1967-03 | 3.80 | ||
| 1967-04 | 3.80 | ||
| 1967-05 | 3.80 | ||
| 1967-06 | 3.90 | ||
| 1967-07 | 3.80 | ||
| 1967-08 | 3.80 | ||
| 1967-09 | 3.80 | ||
| 1967-10 | 4.00 | ||
| 1967-11 | 3.90 | ||
| 1967-12 | 3.80 | ||
| 1968-01 | 3.70 | ||
| 1968-02 | 3.80 | Min. Wage = $1.6 | |
| 1968-03 | 3.70 | ||
| 1968-04 | 3.50 | ||
| 1968-05 | 3.50 | ||
| 1968-06 | 3.70 | ||
| 1968-07 | 3.70 | ||
| 1968-08 | 3.50 | ||
| 1968-09 | 3.40 | ||
| 1968-10 | 3.40 | ||
| 1968-11 | 3.40 | ||
| 1968-12 | 3.40 | ||
| 1969-01 | 3.40 | Nixon | |
| 1969-02 | 3.40 | ||
| 1969-03 | 3.40 | ||
| 1969-04 | 3.40 | ||
| 1969-05 | 3.40 | ||
| 1969-06 | 3.50 | ||
| 1969-07 | 3.50 | ||
| 1969-08 | 3.50 | Tax Reform Act of 1969, dec. | |
| 1969-09 | 3.70 | ||
| 1969-10 | 3.70 | ||
| 1969-11 | 3.50 | ||
| 1969-12 | 3.50 | ||
| 1970-01 | 3.90 | ||
| 1970-02 | 4.20 | ||
| 1970-03 | 4.40 | ||
| 1970-04 | 4.60 | ||
| 1970-05 | 4.80 | ||
| 1970-06 | 4.90 | ||
| 1970-07 | 5.00 | ||
| 1970-08 | 5.10 | ||
| 1970-09 | 5.40 | ||
| 1970-10 | 5.50 | ||
| 1970-11 | 5.90 | ||
| 1970-12 | 6.10 | ||
| 1971-01 | 5.90 | ||
| 1971-02 | 5.90 | ||
| 1971-03 | 6.00 | ||
| 1971-04 | 5.90 | ||
| 1971-05 | 5.90 | ||
| 1971-06 | 5.90 | ||
| 1971-07 | 6.00 | ||
| 1971-08 | 6.10 | ||
| 1971-09 | 6.00 | ||
| 1971-10 | 5.80 | ||
| 1971-11 | 6.00 | ||
| 1971-12 | 6.00 | ||
| 1972-01 | 5.80 | ||
| 1972-02 | 5.70 | ||
| 1972-03 | 5.80 | ||
| 1972-04 | 5.70 | ||
| 1972-05 | 5.70 | ||
| 1972-06 | 5.70 | ||
| 1972-07 | 5.60 | ||
| 1972-08 | 5.60 | ||
| 1972-09 | 5.50 | ||
| 1972-10 | 5.60 | ||
| 1972-11 | 5.30 | ||
| 1972-12 | 5.20 | ||
| 1973-01 | 4.90 | ||
| 1973-02 | 5.00 | ||
| 1973-03 | 4.90 | ||
| 1973-04 | 5.00 | ||
| 1973-05 | 4.90 | ||
| 1973-06 | 4.90 | ||
| 1973-07 | 4.80 | ||
| 1973-08 | 4.80 | ||
| 1973-09 | 4.80 | ||
| 1973-10 | 4.60 | ||
| 1973-11 | 4.80 | ||
| 1973-12 | 4.90 | ||
| 1974-01 | 5.10 | ||
| 1974-02 | 5.20 | ||
| 1974-03 | 5.10 | ||
| 1974-04 | 5.10 | ||
| 1974-05 | 5.10 | Min. Wage = $2 | |
| 1974-06 | 5.40 | ||
| 1974-07 | 5.50 | ||
| 1974-08 | 5.50 | Ford | |
| 1974-09 | 5.90 | ||
| 1974-10 | 6.00 | ||
| 1974-11 | 6.60 | ||
| 1974-12 | 7.20 | ||
| 1975-01 | 8.10 | Min. Wage = $2.1 | |
| 1975-02 | 8.10 | ||
| 1975-03 | 8.60 | ||
| 1975-04 | 8.80 | US Exits Vietnam War | |
| 1975-05 | 9.00 | ||
| 1975-06 | 8.80 | ||
| 1975-07 | 8.60 | ||
| 1975-08 | 8.40 | ||
| 1975-09 | 8.40 | ||
| 1975-10 | 8.40 | ||
| 1975-11 | 8.30 | ||
| 1975-12 | 8.20 | ||
| 1976-01 | 7.90 | Min. Wage = $2.3 | |
| 1976-02 | 7.70 | ||
| 1976-03 | 7.60 | ||
| 1976-04 | 7.70 | ||
| 1976-05 | 7.40 | ||
| 1976-06 | 7.60 | ||
| 1976-07 | 7.80 | ||
| 1976-08 | 7.80 | ||
| 1976-09 | 7.60 | ||
| 1976-10 | 7.70 | ||
| 1976-11 | 7.80 | ||
| 1976-12 | 7.80 | ||
| 1977-01 | 7.50 | Carter | |
| 1977-02 | 7.60 | ||
| 1977-03 | 7.40 | ||
| 1977-04 | 7.20 | ||
| 1977-05 | 7.00 | ||
| 1977-06 | 7.20 | ||
| 1977-07 | 6.90 | ||
| 1977-08 | 7.00 | ||
| 1977-09 | 6.80 | ||
| 1977-10 | 6.80 | ||
| 1977-11 | 6.80 | ||
| 1977-12 | 6.40 | ||
| 1978-01 | 6.40 | Min. Wage = $2.65 | |
| 1978-02 | 6.30 | ||
| 1978-03 | 6.30 | ||
| 1978-04 | 6.10 | ||
| 1978-05 | 6.00 | ||
| 1978-06 | 5.90 | ||
| 1978-07 | 6.20 | ||
| 1978-08 | 5.90 | ||
| 1978-09 | 6.00 | ||
| 1978-10 | 5.80 | ||
| 1978-11 | 5.90 | ||
| 1978-12 | 6.00 | ||
| 1979-01 | 5.90 | Min. Wage = $2.9 | |
| 1979-02 | 5.90 | ||
| 1979-03 | 5.80 | Three Mile Island meltdown | |
| 1979-04 | 5.80 | ||
| 1979-05 | 5.60 | ||
| 1979-06 | 5.70 | ||
| 1979-07 | 5.70 | ||
| 1979-08 | 6.00 | ||
| 1979-09 | 5.90 | ||
| 1979-10 | 6.00 | ||
| 1979-11 | 5.90 | ||
| 1979-12 | 6.00 | ||
| 1980-01 | 6.30 | Min. Wage = $3.1 | |
| 1980-02 | 6.30 | ||
| 1980-03 | 6.30 | ||
| 1980-04 | 6.90 | ||
| 1980-05 | 7.50 | ||
| 1980-06 | 7.60 | ||
| 1980-07 | 7.80 | ||
| 1980-08 | 7.70 | ||
| 1980-09 | 7.50 | ||
| 1980-10 | 7.50 | ||
| 1980-11 | 7.50 | ||
| 1980-12 | 7.20 | ||
| 1981-01 | 7.50 | Reagan Min. Wage = $3.35 |
|
| 1981-02 | 7.40 | ||
| 1981-03 | 7.40 | ||
| 1981-04 | 7.20 | ||
| 1981-05 | 7.50 | ||
| 1981-06 | 7.50 | ||
| 1981-07 | 7.20 | ||
| 1981-08 | 7.40 | Economic Recovery Tax Act of 1981, dec. | |
| 1981-09 | 7.60 | ||
| 1981-10 | 7.90 | ||
| 1981-11 | 8.30 | ||
| 1981-12 | 8.50 | ||
| 1982-01 | 8.60 | ||
| 1982-02 | 8.90 | ||
| 1982-03 | 9.00 | ||
| 1982-04 | 9.30 | ||
| 1982-05 | 9.40 | ||
| 1982-06 | 9.60 | ||
| 1982-07 | 9.80 | ||
| 1982-08 | 9.80 | ||
| 1982-09 | 10.10 | ||
| 1982-10 | 10.40 | ||
| 1982-11 | 10.80 | ||
| 1982-12 | 10.80 | ||
| 1983-01 | 10.40 | ||
| 1983-02 | 10.40 | ||
| 1983-03 | 10.30 | ||
| 1983-04 | 10.20 | ||
| 1983-05 | 10.10 | ||
| 1983-06 | 10.10 | ||
| 1983-07 | 9.40 | ||
| 1983-08 | 9.50 | ||
| 1983-09 | 9.20 | ||
| 1983-10 | 8.80 | US invades Grenada | |
| 1983-11 | 8.50 | ||
| 1983-12 | 8.30 | ||
| 1984-01 | 8.00 | ||
| 1984-02 | 7.80 | ||
| 1984-03 | 7.80 | ||
| 1984-04 | 7.70 | ||
| 1984-05 | 7.40 | ||
| 1984-06 | 7.20 | ||
| 1984-07 | 7.50 | ||
| 1984-08 | 7.50 | ||
| 1984-09 | 7.30 | ||
| 1984-10 | 7.40 | ||
| 1984-11 | 7.20 | ||
| 1984-12 | 7.30 | ||
| 1985-01 | 7.30 | ||
| 1985-02 | 7.20 | ||
| 1985-03 | 7.20 | ||
| 1985-04 | 7.30 | ||
| 1985-05 | 7.20 | ||
| 1985-06 | 7.40 | ||
| 1985-07 | 7.40 | ||
| 1985-08 | 7.10 | ||
| 1985-09 | 7.10 | ||
| 1985-10 | 7.10 | ||
| 1985-11 | 7.00 | ||
| 1985-12 | 7.00 | ||
| 1986-01 | 6.70 | Shuttle Challenger Disaster | |
| 1986-02 | 7.20 | ||
| 1986-03 | 7.20 | ||
| 1986-04 | 7.10 | ||
| 1986-05 | 7.20 | ||
| 1986-06 | 7.20 | ||
| 1986-07 | 7.00 | ||
| 1986-08 | 6.90 | ||
| 1986-09 | 7.00 | ||
| 1986-10 | 7.00 | The Tax Reform Act of 1986, dec. | |
| 1986-11 | 6.90 | ||
| 1986-12 | 6.60 | ||
| 1987-01 | 6.60 | ||
| 1987-02 | 6.60 | ||
| 1987-03 | 6.60 | ||
| 1987-04 | 6.30 | ||
| 1987-05 | 6.30 | ||
| 1987-06 | 6.20 | ||
| 1987-07 | 6.10 | ||
| 1987-08 | 6.00 | ||
| 1987-09 | 5.90 | ||
| 1987-10 | 6.00 | ||
| 1987-11 | 5.80 | ||
| 1987-12 | 5.70 | ||
| 1988-01 | 5.70 | ||
| 1988-02 | 5.70 | ||
| 1988-03 | 5.70 | ||
| 1988-04 | 5.40 | ||
| 1988-05 | 5.60 | ||
| 1988-06 | 5.40 | ||
| 1988-07 | 5.40 | ||
| 1988-08 | 5.60 | ||
| 1988-09 | 5.40 | ||
| 1988-10 | 5.40 | ||
| 1988-11 | 5.30 | ||
| 1988-12 | 5.30 | ||
| 1989-01 | 5.40 | Bush, G.H.W. | |
| 1989-02 | 5.20 | ||
| 1989-03 | 5.00 | ||
| 1989-04 | 5.20 | ||
| 1989-05 | 5.20 | ||
| 1989-06 | 5.30 | ||
| 1989-07 | 5.20 | ||
| 1989-08 | 5.20 | ||
| 1989-09 | 5.30 | ||
| 1989-10 | 5.30 | ||
| 1989-11 | 5.40 | ||
| 1989-12 | 5.40 | US Invades Panama | |
| 1990-01 | 5.40 | ||
| 1990-02 | 5.30 | ||
| 1990-03 | 5.20 | ||
| 1990-04 | 5.40 | Min. Wage = $3.8 | |
| 1990-05 | 5.40 | ||
| 1990-06 | 5.20 | ||
| 1990-07 | 5.50 | ||
| 1990-08 | 5.70 | ||
| 1990-09 | 5.90 | ||
| 1990-10 | 5.90 | ||
| 1990-11 | 6.20 | Revenue Reconciliation Act of 1990, inc. | |
| 1990-12 | 6.30 | ||
| 1991-01 | 6.40 | Persian Gulf War | |
| 1991-02 | 6.60 | ||
| 1991-03 | 6.80 | ||
| 1991-04 | 6.70 | Min. Wage = $4.25 | |
| 1991-05 | 6.90 | ||
| 1991-06 | 6.90 | ||
| 1991-07 | 6.80 | ||
| 1991-08 | 6.90 | ||
| 1991-09 | 6.90 | ||
| 1991-10 | 7.00 | ||
| 1991-11 | 7.00 | ||
| 1991-12 | 7.30 | ||
| 1992-01 | 7.30 | ||
| 1992-02 | 7.40 | US & Russian declare end of cold war | |
| 1992-03 | 7.40 | ||
| 1992-04 | 7.40 | ||
| 1992-05 | 7.60 | ||
| 1992-06 | 7.80 | ||
| 1992-07 | 7.70 | ||
| 1992-08 | 7.60 | ||
| 1992-09 | 7.60 | ||
| 1992-10 | 7.30 | ||
| 1992-11 | 7.40 | ||
| 1992-12 | 7.40 | ||
| 1993-01 | 7.30 | Clinton | |
| 1993-02 | 7.10 | World Trade Center Bombed | |
| 1993-03 | 7.00 | ||
| 1993-04 | 7.10 | ||
| 1993-05 | 7.10 | ||
| 1993-06 | 7.00 | ||
| 1993-07 | 6.90 | ||
| 1993-08 | 6.80 | Revenue Reconciliation Act of 1993, inc. | |
| 1993-09 | 6.70 | ||
| 1993-10 | 6.80 | ||
| 1993-11 | 6.60 | ||
| 1993-12 | 6.50 | ||
| 1994-01 | 6.60 | ||
| 1994-02 | 6.60 | ||
| 1994-03 | 6.50 | ||
| 1994-04 | 6.40 | ||
| 1994-05 | 6.10 | ||
| 1994-06 | 6.10 | ||
| 1994-07 | 6.10 | ||
| 1994-08 | 6.00 | ||
| 1994-09 | 5.90 | ||
| 1994-10 | 5.80 | ||
| 1994-11 | 5.60 | ||
| 1994-12 | 5.50 | ||
| 1995-01 | 5.60 | ||
| 1995-02 | 5.40 | ||
| 1995-03 | 5.40 | ||
| 1995-04 | 5.80 | ||
| 1995-05 | 5.60 | ||
| 1995-06 | 5.60 | ||
| 1995-07 | 5.70 | ||
| 1995-08 | 5.70 | ||
| 1995-09 | 5.60 | ||
| 1995-10 | 5.50 | ||
| 1995-11 | 5.60 | ||
| 1995-12 | 5.60 | ||
| 1996-01 | 5.60 | ||
| 1996-02 | 5.50 | ||
| 1996-03 | 5.50 | ||
| 1996-04 | 5.60 | ||
| 1996-05 | 5.60 | ||
| 1996-06 | 5.30 | ||
| 1996-07 | 5.50 | ||
| 1996-08 | 5.10 | ||
| 1996-09 | 5.20 | ||
| 1996-10 | 5.20 | Min. Wage = $4.75 | |
| 1996-11 | 5.40 | ||
| 1996-12 | 5.40 | ||
| 1997-01 | 5.30 | ||
| 1997-02 | 5.20 | ||
| 1997-03 | 5.20 | ||
| 1997-04 | 5.10 | ||
| 1997-05 | 4.90 | ||
| 1997-06 | 5.00 | ||
| 1997-07 | 4.90 | ||
| 1997-08 | 4.80 | The Taxpayer Relief Act of 1997, dec. | |
| 1997-09 | 4.90 | Min. Wage = $5.15 | |
| 1997-10 | 4.70 | ||
| 1997-11 | 4.60 | ||
| 1997-12 | 4.70 | ||
| 1998-01 | 4.60 | ||
| 1998-02 | 4.60 | ||
| 1998-03 | 4.70 | ||
| 1998-04 | 4.30 | ||
| 1998-05 | 4.40 | ||
| 1998-06 | 4.50 | ||
| 1998-07 | 4.50 | ||
| 1998-08 | 4.50 | ||
| 1998-09 | 4.60 | ||
| 1998-10 | 4.50 | ||
| 1998-11 | 4.40 | ||
| 1998-12 | 4.40 | ||
| 1999-01 | 4.30 | ||
| 1999-02 | 4.40 | ||
| 1999-03 | 4.20 | ||
| 1999-04 | 4.30 | ||
| 1999-05 | 4.20 | ||
| 1999-06 | 4.30 | ||
| 1999-07 | 4.30 | ||
| 1999-08 | 4.20 | ||
| 1999-09 | 4.20 | ||
| 1999-10 | 4.10 | ||
| 1999-11 | 4.10 | ||
| 1999-12 | 4.00 | ||
| 2000-01 | 4.00 | ||
| 2000-02 | 4.10 | ||
| 2000-03 | 4.00 | ||
| 2000-04 | 3.80 | ||
| 2000-05 | 4.00 | ||
| 2000-06 | 4.00 | ||
| 2000-07 | 4.00 | ||
| 2000-08 | 4.10 | ||
| 2000-09 | 3.90 | ||
| 2000-10 | 3.90 | ||
| 2000-11 | 3.90 | ||
| 2000-12 | 3.90 | ||
| 2001-01 | 4.20 | Bush, G.W. | |
| 2001-02 | 4.20 | ||
| 2001-03 | 4.30 | ||
| 2001-04 | 4.40 | ||
| 2001-05 | 4.30 | ||
| 2001-06 | 4.50 | Tax Relief & Reconciliation Act of 2001, dec. | |
| 2001-07 | 4.60 | ||
| 2001-08 | 4.90 | ||
| 2001-09 | 5.00 | 9/11 terrorist attack | |
| 2001-10 | 5.30 | US enters Afghanistan War | |
| 2001-11 | 5.50 | ||
| 2001-12 | 5.70 | ||
| 2002-01 | 5.70 | ||
| 2002-02 | 5.70 | ||
| 2002-03 | 5.70 | ||
| 2002-04 | 5.90 | ||
| 2002-05 | 5.80 | ||
| 2002-06 | 5.80 | ||
| 2002-07 | 5.80 | ||
| 2002-08 | 5.70 | ||
| 2002-09 | 5.70 | ||
| 2002-10 | 5.70 | ||
| 2002-11 | 5.90 | ||
| 2002-12 | 6.00 | ||
| 2003-01 | 5.80 | ||
| 2003-02 | 5.90 | Shuttle Columbia Disaster | |
| 2003-03 | 5.90 | US enters Iraq War | |
| 2003-04 | 6.00 | ||
| 2003-05 | 6.10 | Tax Relief & Reconciliation Act of 2003, dec. | |
| 2003-06 | 6.30 | ||
| 2003-07 | 6.20 | ||
| 2003-08 | 6.10 | ||
| 2003-09 | 6.10 | ||
| 2003-10 | 6.00 | ||
| 2003-11 | 5.80 | ||
| 2003-12 | 5.70 | ||
| 2004-01 | 5.70 | ||
| 2004-02 | 5.60 | ||
| 2004-03 | 5.80 | ||
| 2004-04 | 5.60 | ||
| 2004-05 | 5.60 | ||
| 2004-06 | 5.60 | ||
| 2004-07 | 5.50 | ||
| 2004-08 | 5.40 | ||
| 2004-09 | 5.40 | ||
| 2004-10 | 5.50 | ||
| 2004-11 | 5.40 | ||
| 2004-12 | 5.40 | ||
| 2005-01 | 5.30 | ||
| 2005-02 | 5.40 | ||
| 2005-03 | 5.20 | ||
| 2005-04 | 5.20 | ||
| 2005-05 | 5.10 | ||
| 2005-06 | 5.00 | ||
| 2005-07 | 5.00 | ||
| 2005-08 | 4.90 | ||
| 2005-09 | 5.00 | ||
| 2005-10 | 5.00 | ||
| 2005-11 | 5.00 | ||
| 2005-12 | 4.90 | ||
| 2006-01 | 4.70 | ||
| 2006-02 | 4.80 | ||
| 2006-03 | 4.70 | ||
| 2006-04 | 4.70 | ||
| 2006-05 | 4.60 | ||
| 2006-06 | 4.60 | ||
| 2006-07 | 4.70 | ||
| 2006-08 | 4.70 | ||
| 2006-09 | 4.50 | ||
| 2006-10 | 4.40 | ||
| 2006-11 | 4.50 | ||
| 2006-12 | 4.40 | ||
| 2007-01 | 4.60 | ||
| 2007-02 | 4.50 | ||
| 2007-03 | 4.40 | ||
| 2007-04 | 4.50 | ||
| 2007-05 | 4.40 | ||
| 2007-06 | 4.60 | ||
| 2007-07 | 4.70 | Min. Wage = $5.85 | |
| 2007-08 | 4.60 | ||
| 2007-09 | 4.70 | ||
| 2007-10 | 4.70 | ||
| 2007-11 | 4.70 | ||
| 2007-12 | 5.00 | ||
| 2008-01 | 5.00 | ||
| 2008-02 | 4.90 | ||
| 2008-03 | 5.10 | ||
| 2008-04 | 5.00 | ||
| 2008-05 | 5.40 | ||
| 2008-06 | 5.60 | ||
| 2008-07 | 5.80 | Min. Wage = $6.55 | |
| 2008-08 | 6.10 | ||
| 2008-09 | 6.10 | ||
| 2008-10 | 6.50 | ||
| 2008-11 | 6.80 | ||
| 2008-12 | 7.30 | ||
| 2009-01 | 7.80 | Obama | |
| 2009-02 | 8.30 | ||
| 2009-03 | 8.70 | ||
| 2009-04 | 8.90 | ||
| 2009-05 | 9.40 | ||
| 2009-06 | 9.50 | ||
| 2009-07 | 9.50 | Min. Wage = $7.25 | |
| 2009-08 | 9.60 | ||
| 2009-09 | 9.80 | ||
| 2009-10 | 10.00 | ||
| 2009-11 | 9.90 | ||
| 2009-12 | 9.90 | ||
| 2010-01 | 9.70 | ||
| 2010-02 | 9.80 | ||
| 2010-03 | 9.80 | ||
| 2010-04 | 9.90 | ||
| 2010-05 | 9.60 | ||
| 2010-06 | 9.40 | ||
| 2010-07 | 9.50 | ||
| 2010-08 | 9.60 | US exits Iraq War | |
| 2010-09 | 9.50 | ||
| 2010-10 | 9.50 | ||
| 2010-11 | 9.80 | ||
| 2010-12 | 9.40 | ||
| 2011-01 | 9.10 | ||
| 2011-02 | 9.00 | ||
| 2011-03 | 8.90 | ||
| 2011-04 | 9.00 | ||
| 2011-05 | 9.00 | ||
| 2011-06 | 9.10 | ||
| 2011-07 | 9.10 | ||
| 2011-08 | 9.10 | ||
| 2011-09 | 9.00 | ||
| 2011-10 | 8.90 | ||
| 2011-11 | 8.70 | ||
| 2011-12 | 8.50 | ||
| 2012-01 | 8.30 | ||
| 2012-02 | 8.30 | ||
| 2012-03 | 8.20 | ||
| 2012-04 | 8.10 | ||
| 2012-05 | 8.20 | ||
| 2012-06 | 8.20 | ||
| 2012-07 | 8.30 | ||
| 2012-08 | 8.10 | ||
| 2012-09 | 7.80 | ||
| 2012-10 | 7.90 | ||
| 2012-11 | 7.70 | ||
| 2012-12 | 7.80 |
1 comment:
ROFLOL...
You have gone mad trying to prove them wrong by sticking to the facts and charts...
It means nothing to these folks... No more than lies... Perhaps they need to see Mosses magic like the plague or Locus or Seas parting or turning red, or cities vanished like Pompey, etc... before they come to believe what is lie, evil or true...
However, YOU alone with all your facts won't win...
You do have all the truth at your fingertip, screaming they must leave Sodom and Gomorra and its lies... they won't listen... they just want to Know you, biblically before discarding you or folks like you... As Jobe said: The truth means nothing, Get out and don't look back...
I pray you get out and to Galt's Gulch soon? very soon... It won't be long before God of Mosses shows his presence again...
Happy early birthday...
;-)
Post a Comment