
As the Republican primary slogs forward, supporters of Newt Gingrich and Mitt Romney are arguing that the other candidate is "unelectable." The reasoning regarding Gingrich tends to revolve around his horrendous favorability ratings, and a propensity for self-destruction. The rationale regarding Romney is more varied, and is well enunciated by Quin Hillyer and John Hawkins. Last Wednesday, Erick Erickson at RedState -- no Romney fan -- threw up his hands and declared both leading candidates unelectable.
I personally think these claims are overblown. After all, Christine O’Donnell managed to lose the independent vote in Delaware by only three points, and whatever else you may say about Gingrich, he wouldn’t have to begin his general election campaign insisting that he’s not a witch.
But even taking these claims at face value, they tell at most half the story. It’s understandable that the focus would be on Republican candidates in the midst of a GOP primary. But we shouldn’t forget that the general election -- like all incumbent elections -- will largely be a referendum on Barack Obama. And, under current conditions, Obama is every bit as unelectable as the Republicans supposedly are. Consider:
1) Obama is still unpopular.
Almost all models of presidential elections examine presidential approval ratings (very few use challenger favorability, incidentally), as presidents rarely win many votes of those who disapprove of their performance in office. In other words, Obama probably needs to be pretty close to 50 percent approval on Election Day to secure re-election. (In 2004, George W. Bush was at 49.7 percent in the RCP Average on Election Day.)
As of this writing, Obama’s job approval in the RCP Average is 46.8 percent. For the last month, his job approval in Gallup has bounced around between 42 percent and 46 percent, averaging 44.7 percent.
To put this in perspective, on Election Day 2010, his approval was 45.6 percent in the RCP Average and 44 percent in Gallup. In other words, his rating is roughly where it was when Democrats suffered their worst midterm drubbing since 1938.
Of even greater concern for the president: In the past 18 months, he has exceeded 48 percent in the RCP Average during only two time periods: in the aftermath of the Gabby Giffords shooting, and after the killing of Osama bin Laden. And even these broadly unifying events only moved him into the 51/52 percent range, just beyond what he would need to feel confident of re-election. This suggests that the opinions of about 48 percent of the country are pretty solidified against him.
The president’s had a pretty good few months: He ended the war in Iraq, watched the GOP be-clown itself over the payroll tax cut, received a spate of mildly positive economic news, and disappeared from the public eye while the GOP embarked upon a divisive primary campaign. And yet his approvals are still mired in the mid-40s.
2) The economy is still a millstone.
As I noted above, there has been some good economic news lately. But the flip side of this is that we’ve heard it before: Late 2010 and early 2011 were filled with bullish reports on the economy, as was early 2010 (remember “Recovery Summer”?).
The bigger problem for the president is that things are improving too slowly for him to really reap the benefits. Take a look at the following chart, supplied by Jay Cost, which shows per capita real disposable income (a metric commonly used by political scientists in their models) from the start of each president’s term up to his re-election effort (LBJ/Kennedy are combined, as is Ford with Nixon’s second term).
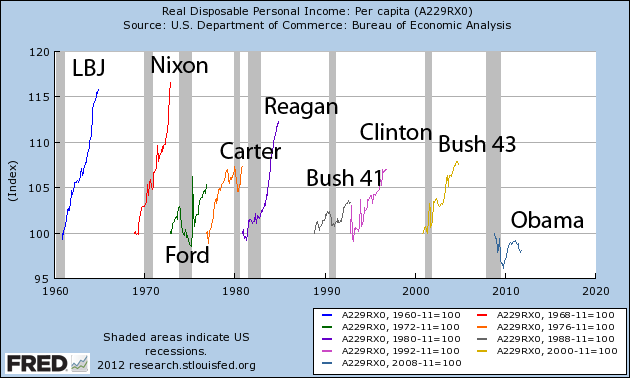
Obama looks quite a bit more like Presidents Ford, Carter and Bush 41 than he does the presidents who have been re-elected.
Of course, this is just one metric. Late last year, Nate Silver examined a variety of economic variables and determined which ones had the best record in predicting presidential elections. Of the 43 variables Silver identified, I’ve pulled the 10 that he found to have the strongest correlation with re-election outcomes. None of the correlations are overwhelmingly strong, but they are decent for these 10.
The following chart shows where each of those variables stand based upon the most recent available data. The right-hand column shows where these variables stood at the end of the third quarter of 2010. Note that in almost every instance, the variable today is worse than it was then (which, again, most agree was a bad time to be a Democrat).
The next chart requires some explanation. What I’ve done is try to get a more holistic view of the present economy, compared to where it stood in previous presidential elections. I’ve done this by taking each of the 10 variables and calculating where they stood in the 13 elections since 1960 (Kennedy-Nixon being the first one where we had data for all 10), as well as where they currently stand.
For each variable, I ranked each election (plus the present data), from best (1) to worst (14). (The individual rankings can be seen here). So, for example, the best Q1-Q3 real disposable income growth in a presidential year was 3.3 percent in 1964, so it received a 1. The next best was 1984, with 2.8 percent growth; it received a 2. And so forth, down to the present reading (-.9 percent), which gets a 14.
The following chart is the average ranking that each year received across the 10 variables. So, 1984 averaged a ranking of 2 across the 10 variables -- the best “election economy” on record, while 1980 almost always came in last, with an average of 13.5. This gives us a spitball estimate of how the present economy rates compared to other economies in election years. I’ve also bolded years that resulted in a change in partisan control of the presidency.
This sorts out roughly as we’d expect, with blowout years at the top and the bottom. As you can see, the current economy isn’t quite in 1980/2008 disaster territory, but it is clearly toward the bottom of the heap, and in the middle of the elections where incumbent parties lost the presidency.
As a final metric, I compared today’s measure of the different quality of life/economic variables that Gallup tracks relative to where they stood on Election Day 2010. I also included the percentage of Americans who believe the country is on the “wrong track,” according to the RCP Average:
This is again at best a mixed bag, and suggests that the overall perception of the economy and the way things are going in the country haven’t improved much from what was, again, a horrible environment for the Democrats. This, of course, explains why the president’s job approval on the economy -- consistently voters’ number one issue in polling -- was 30 percent in Gallup’s last read. That’s not a number he’s likely to get re-elected with.
Now of course, if things improve, this analysis will change. But you also have to factor in the possibility of things getting even worse: a possible collapse in Europe or, more likely, a huge spike in gas prices over the summer.
3) The president’s domestic agenda is unpopular.
Minneapolis Mayor R.T. Rybak, the DNC’s vice chairman, recently stated that Obama’s national message “will be that he passed the health-care law, single-handedly saved the car industry, ended the wars and has had 22 months of job growth.”
Selling this will be a very difficult task. Almost two years after the health care law passed, only 37.6 percent of Americans are in favor of it, one of the lowest measurements RCP has found. The 22 months of job growth is a nice statistic, but such an argument, made vigorously, risks sounding out of touch to a public that believes that the economy is still in dire straits.
As for the auto bailout, we haven’t had much in the way of recent polling, although close to 60 percent of Americans fairly consistently opposed the bailouts when they were pending before Congress, and a January 2010 Allstate/National Journal Poll suggested only 34 percent of Americans believed the administration’s actions with the auto industry had helped the economy. As for the stimulus, Obama’s other major domestic achievement, in January 2010, 75 percent of Americans said they believed a majority or more of stimulus funds were wasted. Rybak doesn’t mention that achievement, but Mitt Romney or Newt Gingrich will.
The only clear winner here for the president is ending the wars in Iraq and Afghanistan. The problem is, most voters don’t care that much. In the past year, I couldn’t find a single poll where more than 9 percent of adults named the wars as their top priority; that distinction consistently belonged to the economy.
In other words, Obama doesn’t have a major popular domestic initiative to run on. The foreign policy issues where he is strongest are of low salience. This is not where a politician wants to be nine months before Election Day.
4) Head-to-head polling.
This is of limited utility this far out, but it is worth a brief mention. Obama leads Romney by only a 47.5-45.1 margin in the RCP Average. His lead against Gingrich is large, but he’s still only at 51.9 percent, about where his approval rating maxed out after bin Laden was killed.
State polling has been sparse, but let’s consider the following RCP Averages: Romney leads 48.8-42 in New Hampshire; 45.3-45 in Florida (all very recent polling); and 46.6-42.8 in Virginia. Add in the McCain states plus Indiana, and that’s 237 electoral votes -- 33 shy of a victory. The president leads, but is at or below 47 percent, in Pennsylvania, Michigan, Wisconsin, Ohio, North Carolina, Colorado, and Nevada. That’s a dangerous place for any incumbent.
Now, some of this polling was taken when Obama’s approval rating was a few points lower in the fall of 2011, but there are two countervailing points to be made. First, these polls are usually of registered voters or adults (or in PPP’s case, “voters,” a unique variant measuring only those who voted in 2004, ’06 and ’08). Both types of polls are typically a few more points Democratic than the actual electorate.
Second, and of more concern to the president, Public Policy Polling found that in 2011, Obama’s job approval rating among undecided voters in its polls was only 18 percent. In other words, these voters will be inclined to break for a semi-credible GOP nominee. Given that the president is currently well below 50 percent in many of these polls, that’s a huge problem for him.
5) We’ve heard it before.
Finally, most of the arguments for why the president is electable should sound vaguely familiar. They were mostly made in 2010 and offered as reasons why the election wouldn’t be so bad for the Democrats. Here’s the president a few days ago, arguing that the 2012 election would be a choice, not a referendum on his presidency. Here’s David Axelrod, making the exact same argument in 2010.
Here’s an article in Foreign Policy, arguing in part that Republicans are just too unpopular and radical for the American people to hand them the election. Here’s, well, me making a similar argument in 2009.
Here’s Ezra Klein observing that 54 percent of voters still blame Bush for the state of the economy (though in fairness, he notes some limitations to this poll). That’s actually an improvement from 2010.
And so it goes. At least Obama hasn’t resurrected the “Slurpee analogy.”
Conclusion
So what happens? Arguably, we’ve never seen a situation like this before, when an unelectable incumbent draws an unelectable opponent. It’s kind of an “immovable object vs. irresistible force” scenario. In theory, neither candidate should be able to win this election, but in practice, someone must.
At the end of the day, most analysts agree that incumbent elections are primarily referenda on the incumbent party, which helps explain how some normally unelectable candidates like Florida Gov. Rick Scott and Minnesota Sen. Al Franken won elections in swing states against very good opponents, despite deep concerns about their credibility.
But at the presidential level, we probably don’t have much direct experience to draw upon. We should, however, keep in mind that FDR, Jimmy Carter, Ronald Reagan and Bill Clinton were all considered unelectable at various points in their campaigns. FDR had been part of a ticket that lost by 26 points in 1920; Carter was too inexperienced; Reagan was too old and conservative; Clinton was running at a time when people cared if you had smoked marijuana, cheated on your spouse, and avoided the draft.
While we tend to attribute these presidents’ victories to their outsized political skills, I tend to think that’s a bit of the tail wagging the dog. They’re considered great politicians because they won, and not the other way around. (If you doubt me on this, examine assessments of Reagan’s political skills in 1982, or Clinton’s in 1993.) Had the economy not floundered in 1980 and 1992, and not roared ahead in 1984 and 1996, we would remember them as cautionary tales, not maestros.
In any event, I wouldn’t put Obama in Carter/Hoover territory, unless Europe collapses. But then again, Republicans don’t need to reduce his share of the vote to 40 percent. Can “unelectable” Romney or even Gingrich hold him to, say, 48 or 49 percent? I wouldn’t say they will, but there’s plenty of evidence that suggests they can.
No comments:
Post a Comment